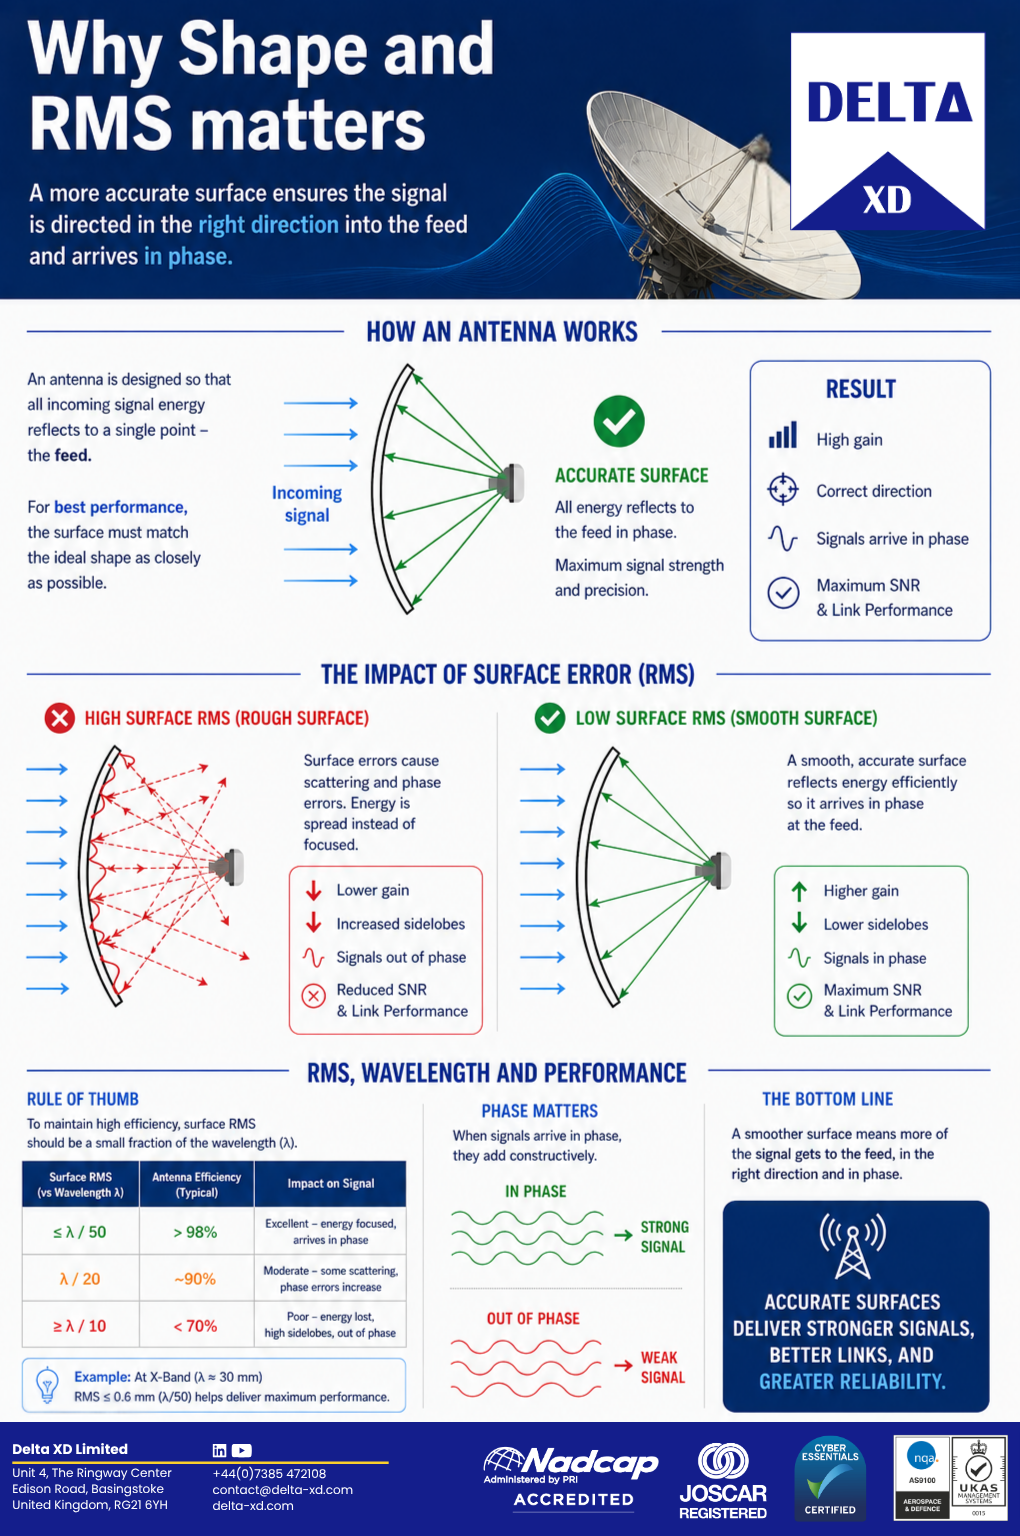
The performance of a large reflector antenna is fundamentally linked to its geometry. The contour of the reflector surface, together with the position of the feed and sub-reflector, defines the geometry presented to the RF system. As operating frequencies increase, the accuracy of these elements becomes increasingly critical, with geometric deviations that may have limited significance at lower frequencies becoming more consequential at Ku-band and Ka-band frequencies.
For antenna operators, integrators and engineering teams, accurate dimensional measurement therefore plays an important role in installation and acceptance, troubleshooting, refurbishment and upgrade assessment.
But measuring a large antenna is about more than simply collecting a point cloud. The challenge is to capture sufficient surface detail while maintaining a reliable global reference across a structure that can be tens of metres in diameter and may change shape as it moves through its operational range.
Measuring the complete antenna geometry
Large reflector antennas present a demanding metrology challenge. A measurement system needs to provide both high-density surface information and global positional accuracy across the complete structure.
Delta XD combines TRITOP System measurement with drone-based photogrammetry to address these requirements. The approach captures a high density of 3D surface measurements while maintaining global accuracy across antennas of virtually any size.
The resulting dataset extends beyond a visual inspection or a limited number of discrete measurement points. It provides a traceable representation of the antenna geometry that can be used to quantify:
- Reflector surface geometry
- RMS surface accuracy
- Maximum surface deviation
- Feed position
- Sub-reflector position
- Astigmatism
- Focus shift
- Surface deviation across the reflector
This provides engineering teams with measurable evidence of the antenna’s condition, rather than relying on visual assessment or assumptions about its geometry.
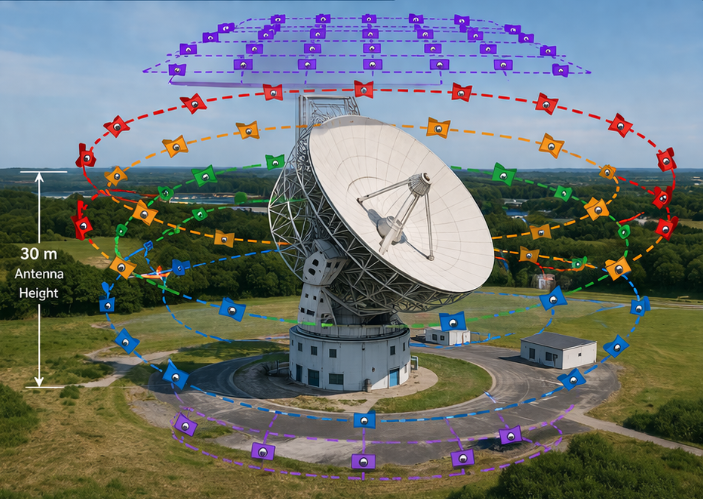
Drone measurement points captured around an antenna at multiple heights and angles.
Why measurement density matters
A large reflector does not necessarily experience performance loss because of one obvious defect. Small geometric errors can be distributed across the surface as a result of panel movement, installation variation, thermal effects, structural ageing, sub-reflector misalignment, focus shift and systematic distortion.
This makes measurement density particularly important.
A relatively small number of measurement points may identify major deviations, but it provides only a limited representation of the complete reflector surface. The calculated RMS value can also be influenced by point placement and individual outliers.
By contrast, high-density photogrammetry allows the surface to be sampled much more comprehensively.
For example, a typical 30 m antenna can be measured at approximately 4,000 points across the reflector, with additional points positioned on the sub-reflector and supporting struts. These additional measurements strengthen the overall measurement network and improve the volumetric definition of the antenna.
The increase in sample size also provides greater statistical confidence in the calculated surface characteristics. Rather than basing an assessment on a small number of discrete measurements, the larger dataset provides a more representative picture of the actual reflector condition.
This distinction becomes particularly important when the measurement results are being used to support engineering decisions around antenna acceptance, adjustment, refurbishment or higher-frequency upgrades.
From “does it look right?” to quantified surface condition
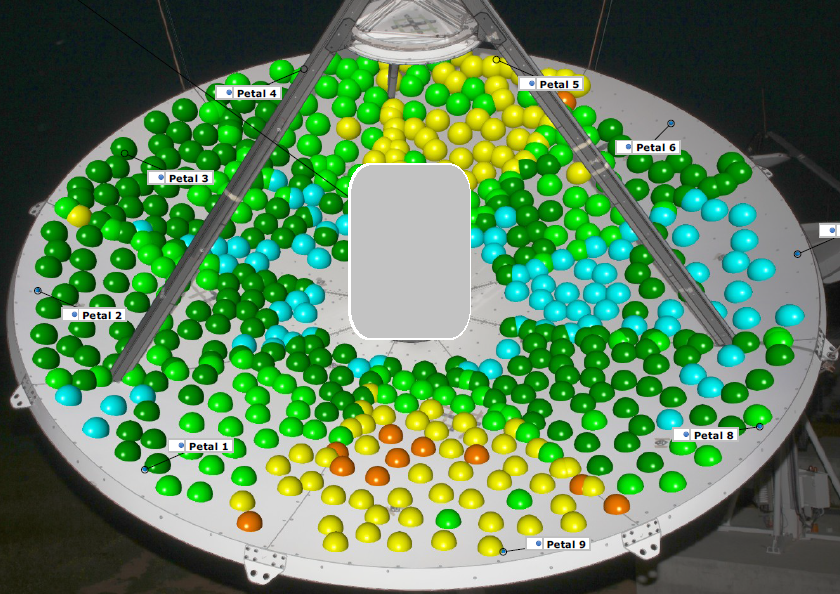
Displacement from nominal surface position across the antenna petals, highlighting areas in and out of specification.
High-density measurement allows engineers to move beyond a simple assessment of whether an antenna appears to conform to its intended shape.
The data can answer more specific questions:
- What is the true RMS surface accuracy?
- Where are the areas of greatest positive and negative deviation?
- Are deviations localised or distributed across the reflector?
- Is the feed or sub-reflector position contributing to performance loss?
- Can adjustment recover the required geometry?
- Is refurbishment necessary?
The objective is not simply to generate more data. It is to reduce uncertainty in the measurements that underpin engineering decisions.
Photogrammetry and the measurement of large structures
Large antennas also require a measurement approach that can maintain accuracy across significant distances.
A single-station measurement technique can provide highly accurate measurements at individual locations, but a sparse measurement strategy does not necessarily capture the complete reflector surface. Conversely, techniques that provide dense surface data need to maintain an accurate global reference if the resulting measurements are to be used to assess the antenna’s overall geometry.
The combined approach used by Delta XD is designed to provide both.
Photogrammetry provides the high-density spatial dataset required to characterise the reflector surface, while the wider measurement network provides the global reference needed to relate the measured surface, feed, sub-reflector and supporting structure.
This is particularly valuable when assessing geometric relationships between different components of the antenna rather than considering the reflector surface in isolation.
An antenna does not have one geometry
One of the most important considerations when measuring a large reflector is that it is not a completely rigid structure.
The geometry measured at one position represents the antenna in that particular configuration. As the antenna changes elevation, the structure can respond to gravity, asymmetric loading, wind and its own structural stiffness. These effects can influence both the reflector contour and the position of components that define the RF geometry.
A reflector that meets its geometric requirements at one elevation may therefore behave differently elsewhere within its operating envelope.
To characterise this behaviour, Delta XD can measure antenna deformation across multiple elevation positions, typically including:
75° → 60° → 45° → 30° → 15° → 0°
The resulting datasets can then be analysed using rigid-body-motion compensation. This allows movement of the antenna as a whole to be separated from genuine deformation of the reflector and associated structures.
The result is a more complete understanding of how the antenna geometry changes throughout its working range.
A single measurement tells you where the antenna was. A deformation study tells you how the antenna behaves.
This distinction can be particularly important when assessing antenna conformance across different positions and orientations, or when considering factors such as link margin, system uptime and the feasibility of a higher-frequency upgrade.
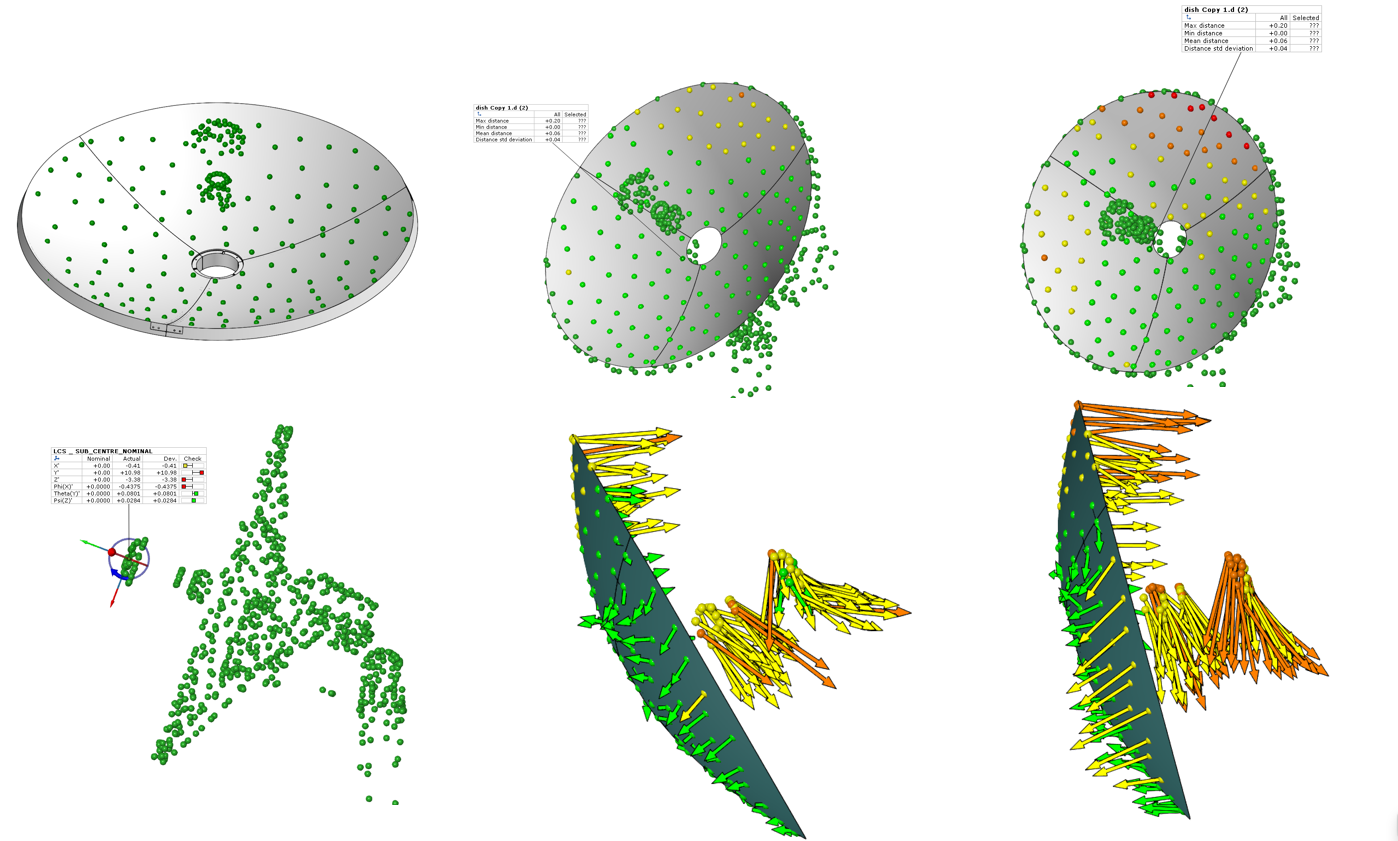
Deformation analysis across thousands of reference points on an antenna surface.
Measuring deformation rather than assuming it
Deformation analysis provides another level of information beyond a static surface measurement.
By comparing datasets acquired at different elevation angles, engineers can identify changes in reflector shape and component position throughout the operational envelope. The resulting analysis can show whether deformation is localised, systematic or associated with particular structural conditions.
This can help identify issues that may not be apparent from a single reference-position measurement.
For example, if the antenna’s reflector contour changes significantly as elevation changes, the effect on the RF geometry needs to be considered alongside the static surface accuracy. Similarly, movement of the sub-reflector or feed relative to the reflector can influence the overall antenna geometry even where the reflector surface itself remains within an expected range.
Measuring these relationships provides a more representative assessment of the antenna under operational conditions.
From measured geometry to engineering outputs
The value of antenna metrology does not end with the point cloud.
The measured geometry can be processed into engineering outputs that describe the condition of the reflector and the key components defining its RF geometry. These include:
- RMS surface accuracy
- Maximum deviation
- Surface deviation maps
- Feed position
- Sub-reflector position
- Astigmatism
- Focus shift
These outputs provide a quantitative basis for assessing the antenna against its intended geometry and identifying areas that may require adjustment or further investigation.
Surface deviation plots can also help engineers understand where errors occur across the reflector rather than reducing the assessment to a single overall value.
This distinction is important because two antennas could have similar overall RMS values while exhibiting very different spatial distributions of error. Understanding where deviations occur can therefore be as important as understanding their magnitude.
From metrology data to predicted RF performance
The ultimate value of precision antenna measurement is not simply knowing the dimensions of the structure. It is understanding what those dimensions mean for performance.
Measured reflector and sub-reflector geometry can be used as inputs for RF modelling, allowing the potential effect of measured geometric errors to be assessed.
Depending on the application, this can include predicted changes in:
- Gain
- Efficiency
- Sidelobe behaviour
- Beam quality
This creates a link between physical measurement and RF performance. Rather than treating the point cloud as the final output, the measured geometry becomes engineering input that can be used to model how the antenna is likely to perform.
Delta XD’s approach combines precision metrology with RF simulation to move from assumptions about antenna condition towards evidence-based performance assessment.
Why this matters for Ku-band and Ka-band upgrades
The need for accurate geometric characterisation becomes increasingly important as operating frequency increases.
An antenna that provides acceptable performance at one frequency is not automatically suitable for a higher-frequency application. As frequency increases, greater demands are placed on the accuracy of the reflector surface and the positioning of the components defining the RF geometry.
For organisations considering a Ku-band or Ka-band upgrade, understanding the existing antenna condition can therefore be an important part of the engineering assessment.
Rather than making an upgrade decision based solely on the age, specification or historical performance of an antenna, precision measurement can provide evidence of its current geometric condition. Combining this with deformation analysis and RF modelling can provide a stronger basis for determining whether adjustment, refurbishment or replacement is the appropriate route.
Turning antenna measurement into engineering confidence
Large antenna metrology is not simply about producing a high-resolution point cloud. The value comes from understanding the geometry represented by that data, quantifying how the structure changes under different conditions and relating the measured geometry back to RF performance.
By combining high-density photogrammetry, global measurement, deformation analysis and RF simulation, Delta XD provides engineering teams with a more complete picture of antenna condition and behaviour.
For antenna installation, acceptance testing, troubleshooting, refurbishment or upgrade assessment, the objective is ultimately the same: replace assumptions about antenna geometry with measurable, traceable data that can support confident engineering decisions.
Want to understand what your antenna geometry means for its performance? Contact Delta XD to discuss your antenna measurement requirements.